Turns a patchwork into a list of plots that reveal each child plot incrementally. Also works with nesting and insets.
Arguments
- pw
A patchwork object
- order
(optional) A numeric vector specifying in which order to reveal the plots
For example, if there are three plots in the patchwork,
order = c(3, 2, 1)will invert the order in which they are revealed.Any plot not included in the vector will be omitted from the incremental plots. E.g.: with
order = c(3, 1), the second plot is not shown.By default, the first plot returned by this function is blank, showing layout elements of the patchwork but none of its child plots. To omit the blank plot, include
-1: e.g.order = c(-1, 3, 1), ororder = -1.
Examples
library(ggplot2)
library(patchwork)
data("mtcars")
p1 <- ggplot(mtcars,
aes(cyl,
fill = factor(am))) +
geom_bar() +
labs(title = "Plot 1")
p2 <- ggplot(mtcars,
aes(disp,
fill = factor(am))) +
geom_histogram() +
labs(title = "Plot 2")
p3 <- ggplot(mtcars,
aes(mpg, wt,
color = factor(vs))) +
geom_point() +
guides(color="none") +
labs(title = "Plot 3")
p4<- p3 +
coord_polar() +
theme_minimal() +
theme(axis.title = element_blank()) +
labs(title = "Plot 4")
pw <- (p1 + p2)/(p3 + inset_element(p4, 0.4, 0.4, 1.4, 1 )) +
plot_layout(guides = "collect")
plot_list <- reveal_patchwork(pw)
#> `stat_bin()` using `bins = 30`. Pick better value `binwidth`.
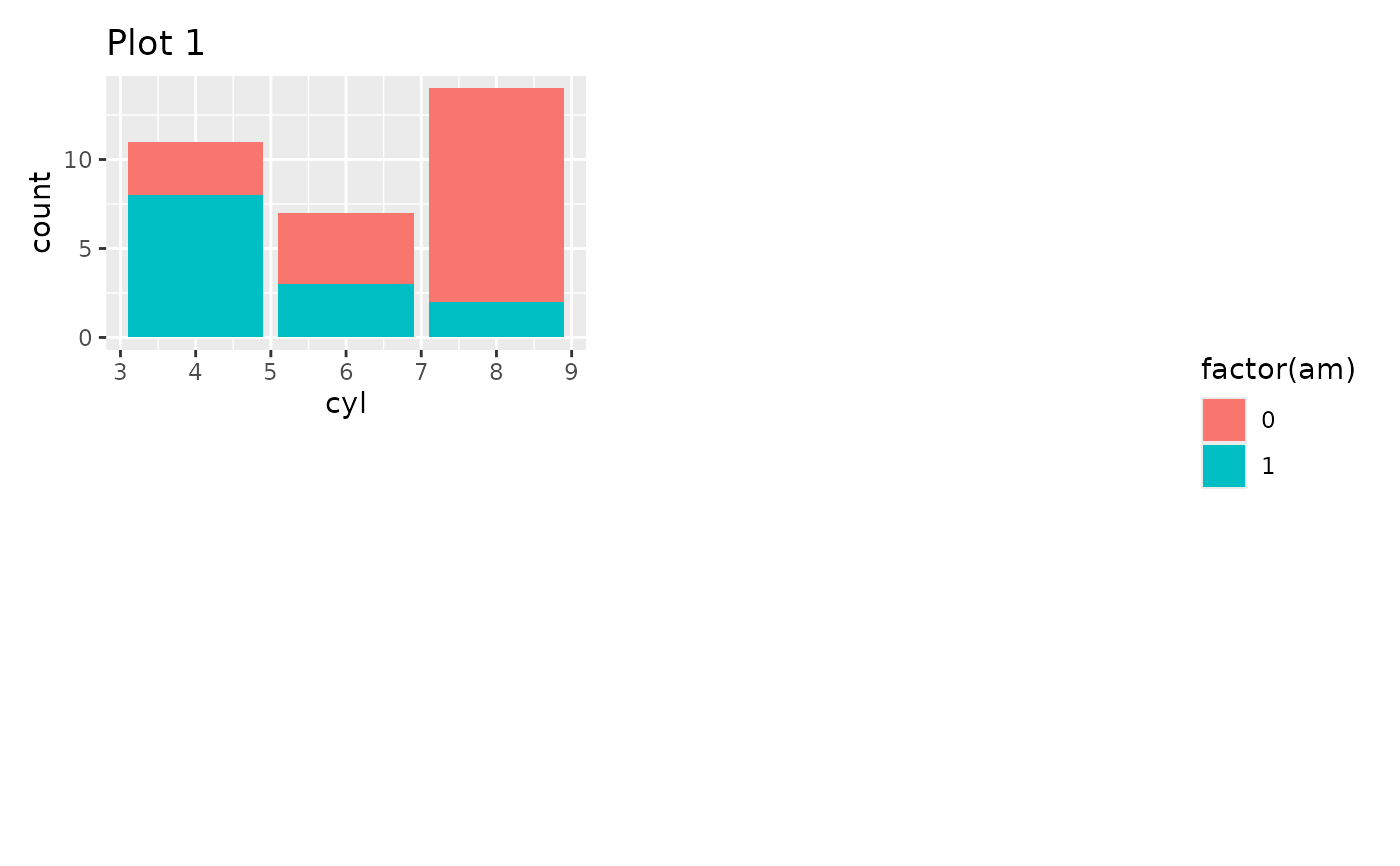
plot_list[[1]]
 plot_list[[2]]
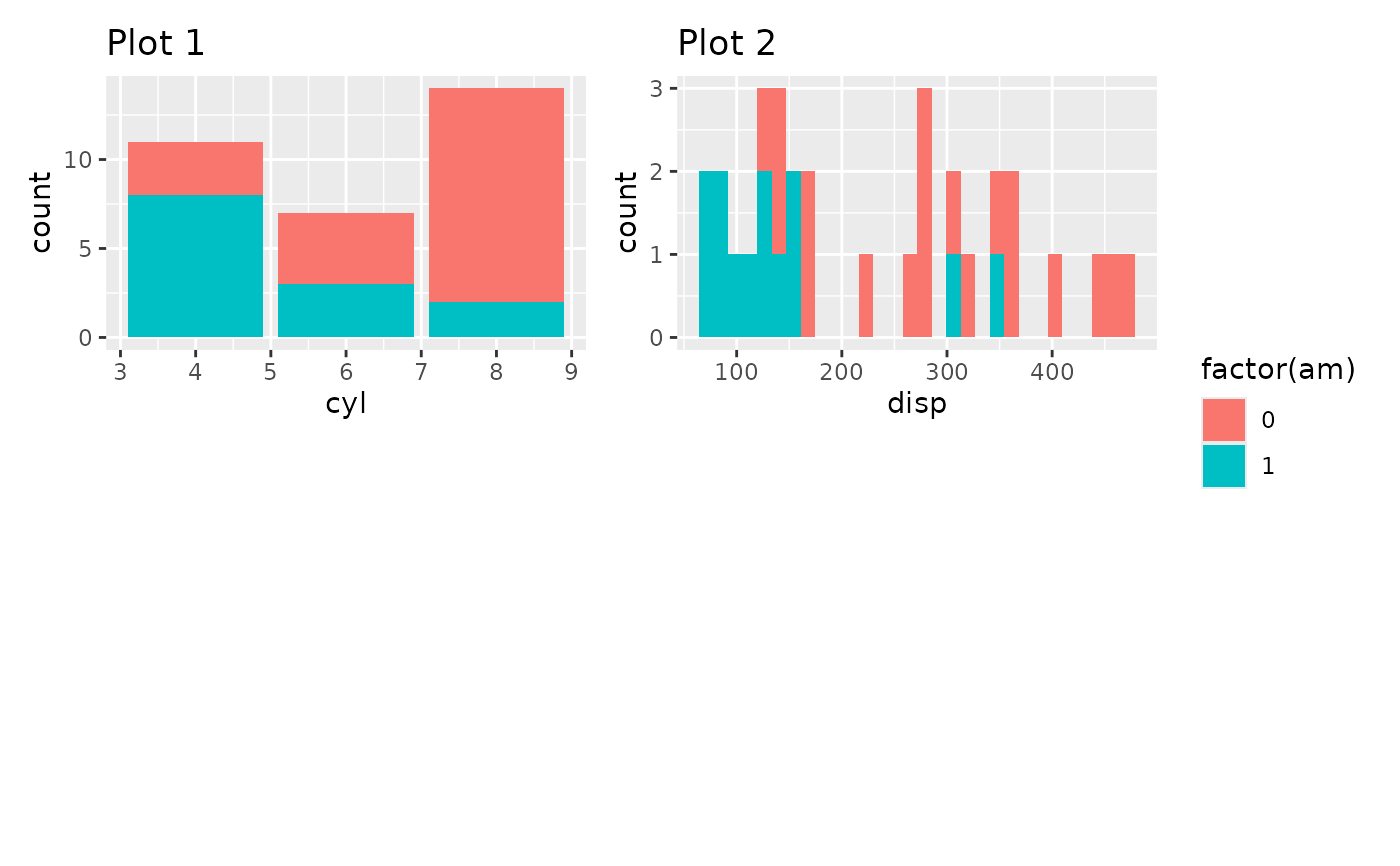
 plot_list[[3]]
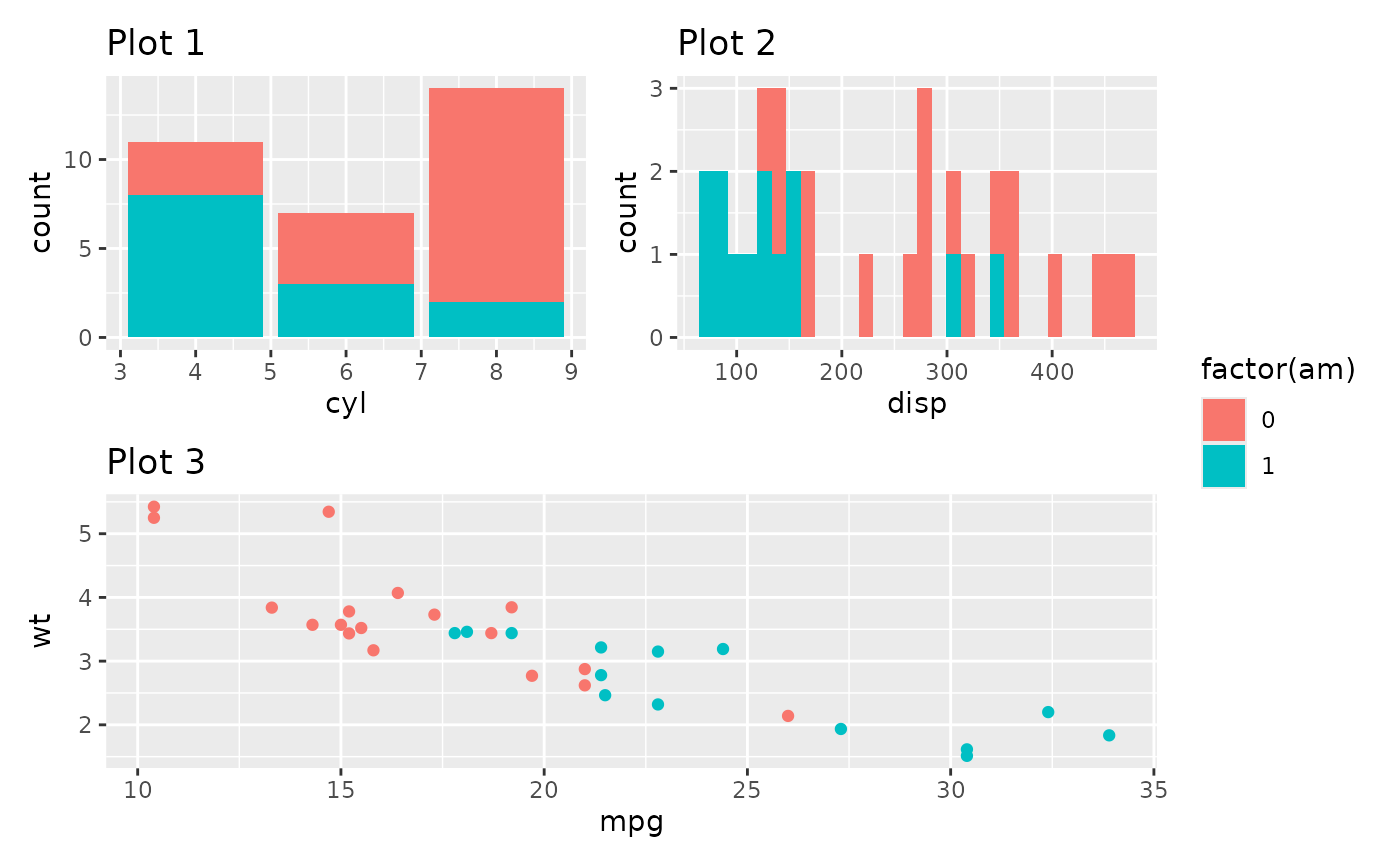
 plot_list[[4]]
 plot_list[[5]]
